Python 3.6 - Matplotlib - simple PLOT
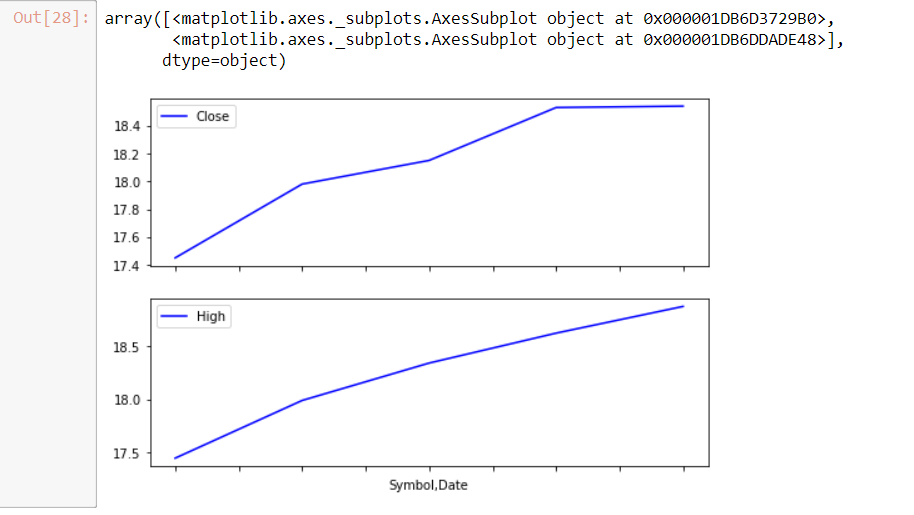
This is a simple example of python plot. You can install all the imported modules by using: pip install numpy, pip install padas etc. import matplotlib as matplotlib from IPython import get_ipython get_ipython().run_line_magic( 'matplotlib' , 'inline' ) import numpy as np import pandas as pd import matplotlib import pandas_datareader as web import matplotlib.pyplot as plt start = '1/1/2018' end = '1/5/2018' ge = web.DataReader( 'GE' , data_source = 'morningstar' , start =start , end =end) ge %matplotlib inline ge[[ 'Close' , 'High' ]].plot( subplots = True , color = 'blue' , figsize =( 8 , 6 ))